Could you detect power cuts in realtime using only Twitter Data? Read more about it below!
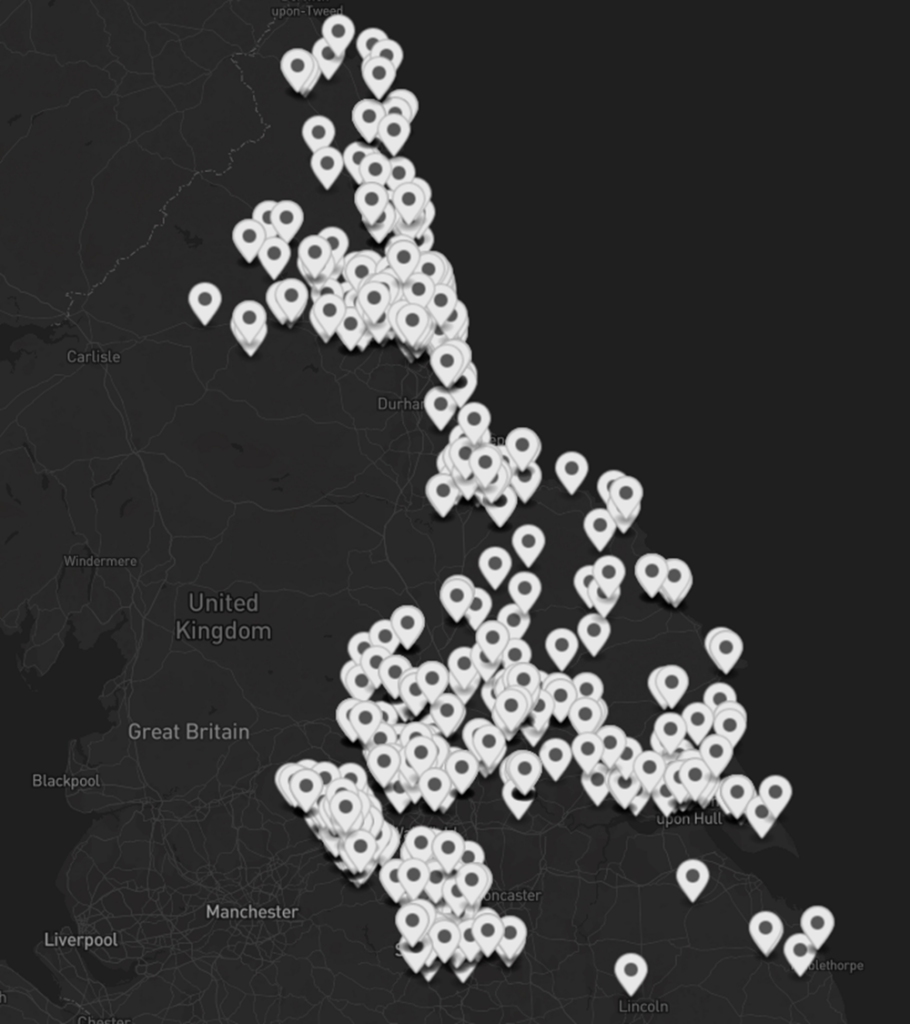
Fancy a look at the map – click here
Over the last 4 weeks Ive been participating in a group project as part of my MRes investigating the potential of providing Local Resilience Forums (LRFs) with access to satellite data and technology. This project forms part of a UK Space Agency-funded scoping initiative entitled R2-D2: Resilience to Recovery – Data for Disasters. As part of that project our groups task was to develop a dashboard presenting data and analysis that could be used for improving resilience to power cuts in 4 weeks.
While not related to satellite data, one of the sources LRFs use in an incident (with a healthy dose of salt) to inform decision making is social media. Could we detect a power cut through this data in real time?
If you have ever been annoyed with a company, whats a good way to complain about them publicly? Twitter. With its Academic API (depending on how long its available for) we could stream tweets in real time to @Northernpowergird to see if someone wasn’t happy. Even better, could we compare it to Northern Power Grid’s Power Cut Map to see if there were any they didn’t know about – though unlikely.

A member of my group investigated using Natural Language Processing to determine if the tweet was complaining about a power cut or not. This is surprisingly difficult, especially when you consider the wit and sarcasm of ‘Geordie Humour’.
@Northernpowergrid had been tweeted 13,000 times in 2021 and 2022. They have had a number of critical events in that time with the damage done to their network in Storm Arwen, Malik and Corrie during that time. They’ve received their fair share of flack as well as praise, but a lot of people regularly tweet them along the lines of:
@Northernpowergrid the powers out in NE6 5
We could use a simple regex to extract the postcode and look it up to see if we could geocode that location. From there its a quick pin drop on a map, something we were able to do with over 1000 tweets!
A Realtime Solution Architecture
One of the LRF experts asked if it was possible to implement this in real time? I had been focusing on some analysis of satellite imagery data but having recently passed my Associate AWS Certified Solutions Architect I thought this would be a good challenge to try. Unfortunately I only managed to get onto the task with 3 days before the deadline. If it worked it would be a good crowd pleaser to show off as a quick Proof of Concept.
I’m a big fan of serverless and some of the lightweight solutions that can be produced by leveraging AWS’s gazillions of services, knowing the right tools for the job is key. Unfortunately there are also many ways to skin a cat but working out the requirements I settled on a potential architecture. Using Appsync (GraphQL) to provide subscription based triggers for a fast and hopefully real time map that could be rendered in an Amplify React based webapp. Definitely a challenge.

Back End Infrastructure
I managed to do most of the back end without any major problems. The back end would only use the tweets from the last 24 hours to make sure only relevant or recent events were detected.
DBScan offered itself as a great unsupervised machine learning algorithm rather than Moran’s-I. This would be key to detect clusters rather than individual tweets. Taking social media with a pinch of salt but instead listening to trends rather than individual tweets. From this I could calculate a minimum bounding circle and ideally present that on the web app.
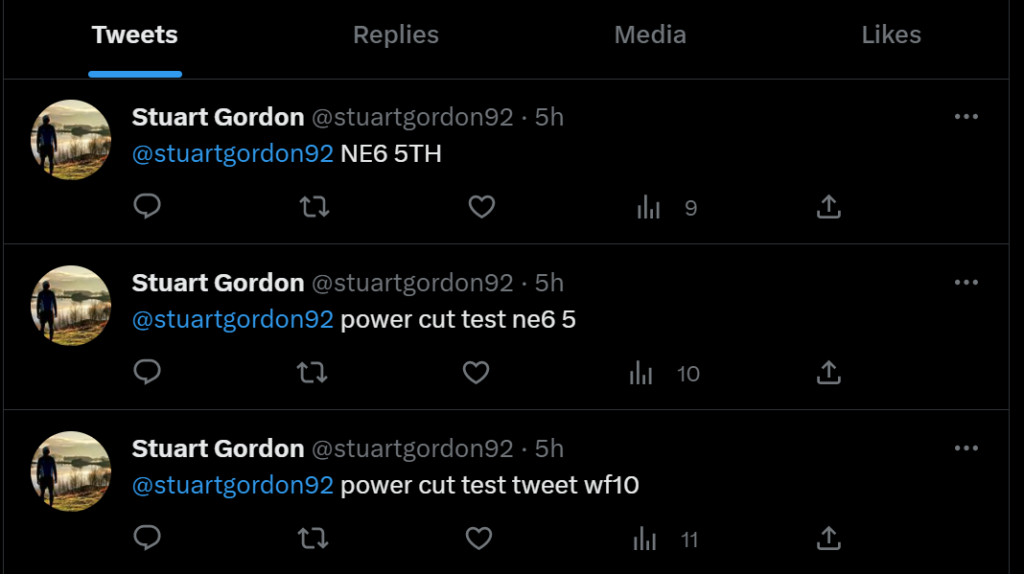
I triggered the Twitter stream from my personal account rather than give Northern Power any more grief. As you can see I sent a lot of random tweets in the past few days!
This all worked great locally testing the python scripts and the GraphQL API, in particular the gql python library came in great use.
However, rather than use an API based location parse or lookup, mainly due to time, we went for a simple local lookup against a postcode dataset.
Rather than load this dataset every time in Lambda it gave me an opportunity to work with docker and package everything up together. In hindsight it was only 20mb and with the volume of tweets probably would have been fine in Lambda, even easier to then trigger the event detector separately. Though with the number of packages required uploading the layers would have been a faff as well. In the end it works, not bad for about 12 hours of work. Back end done!
Front End Infrastructure
At 4pm and 20 hours before our presentation, I set out to build front end from scratch. Not my brightest idea but c’est la vie. It was going to be a long night. The problem however came when I tried to set up the subscription to the API.
Amplify for some reason just wouldn’t push the existing API to the project from my local deployment. I tried rebuilding the Amplify app, trying a different IDE through Cloud9, but nothing would work. This was not what I wanted at 11pm.
So debating between giving up and going to bed or finding another option it would be annoying to have developed a great back end but not be able to prove it. “So here’s my lovely database” just doesn’t cut the mustard in presentations.
With that I set myself a 3am deadline. What could I write in 4 hours? JavaScript is not my friend at the best of times. Python would be the best bet!
I had previously made an interactive train graph in Dash using python for the Newcastle Nexus Metro so when back to see what I could reuse from that project. I could also reuse the existing functions from the back end scripts to connect to the API. Work smarter not harder.

Unfortunately there doesn’t seem to be a good library for handling subscriptions from python with GraphQL. My dream of an asynchronous subscription based map redraw had crumbled and I succumbed to the usual, a periodical refresh. This was such a shame, I had great hopes of the architecture working out but alas with by bed calling I just wanted something to work end to end. To be fair, Dash saved the day, quick simple but very effective and could be deployed as an Elastic Beanstalk web application with minimal mucking about.
The Solution
You can check out the TwitterMap yourself, I wouldn’t suggest tweeting @Northernpowergrid about theoretical power cuts, but its also triggered my personal account @StuartGordon92.

An event should trigger if between 3 and 5 tweets in a close area are processed within 24 hours. Just make sure you include a partial or complete postcode in the North East of England. You can also see the tweets from the last 2 years to Northern Power Grid for reference.
It seems theres an issue down in Scarborough this evening!
In the end it worked end to end and I was able to present it to everyone which went down a treat. Its not how I had hoped, see the actual architecture below. Its certainly not a finished product. But it works, not bad for 3 days. You can see how the architecture ended up below.
There are a whole host of potential improvements I could do to finish this off, the list coming to mind includes:
- Migrate the back end to lambda rather than docker
- Implement the subscription redraw
- Use some of the OpenAPI tools for better location parsing and sentiment analysis
- Fix all the bugs in my last minute dash app
- Compare tweets and clusters to the Northern Power Grid Power Cut API
But the concept worked well, and the ability to parse content generated on social media to detect events could be applied to a host of other things. All in all successful but room for improvement, let alone further development. In the meant time have a look, let me know what you think?
Or check out the code on GitHub and try implement something similar yourself!
Produced by Stuart @ stuart-gordon.co.uk